
 Facebook
 X
X
 Pinterest
 Copy Link
This and other articles about the Yellowknife real estate market are available in our e-newsletter. Click on this link to sign up and receive our latest edition.
 Well, 2020 was pretty crazy. Just like most economic sectors in most countries in the world, COVID-19 left the Canadian real estate sector facing great uncertainty in the months of March and April. Initially, it seemed as though we here in the Northwest Territories would be in the same rough waters as every other province and territory, but while we did experience some things in common with our neighbours, there were some big differences.
Like everyone else, we experienced a significant slowdown for March, April and May, but the market more than compensated with very strong activity starting in June. In some parts of Canada sales hit record monthly highs all the way through to December. In Yellowknife our peak season didn’t quite last that long, but not because the demand wasn’t there. Starting in about October we simply ran out of listings to sell. If you were following our monthly updates you will recall that each and every month the most startling statistic was the drop in inventory compared to a year earlier.
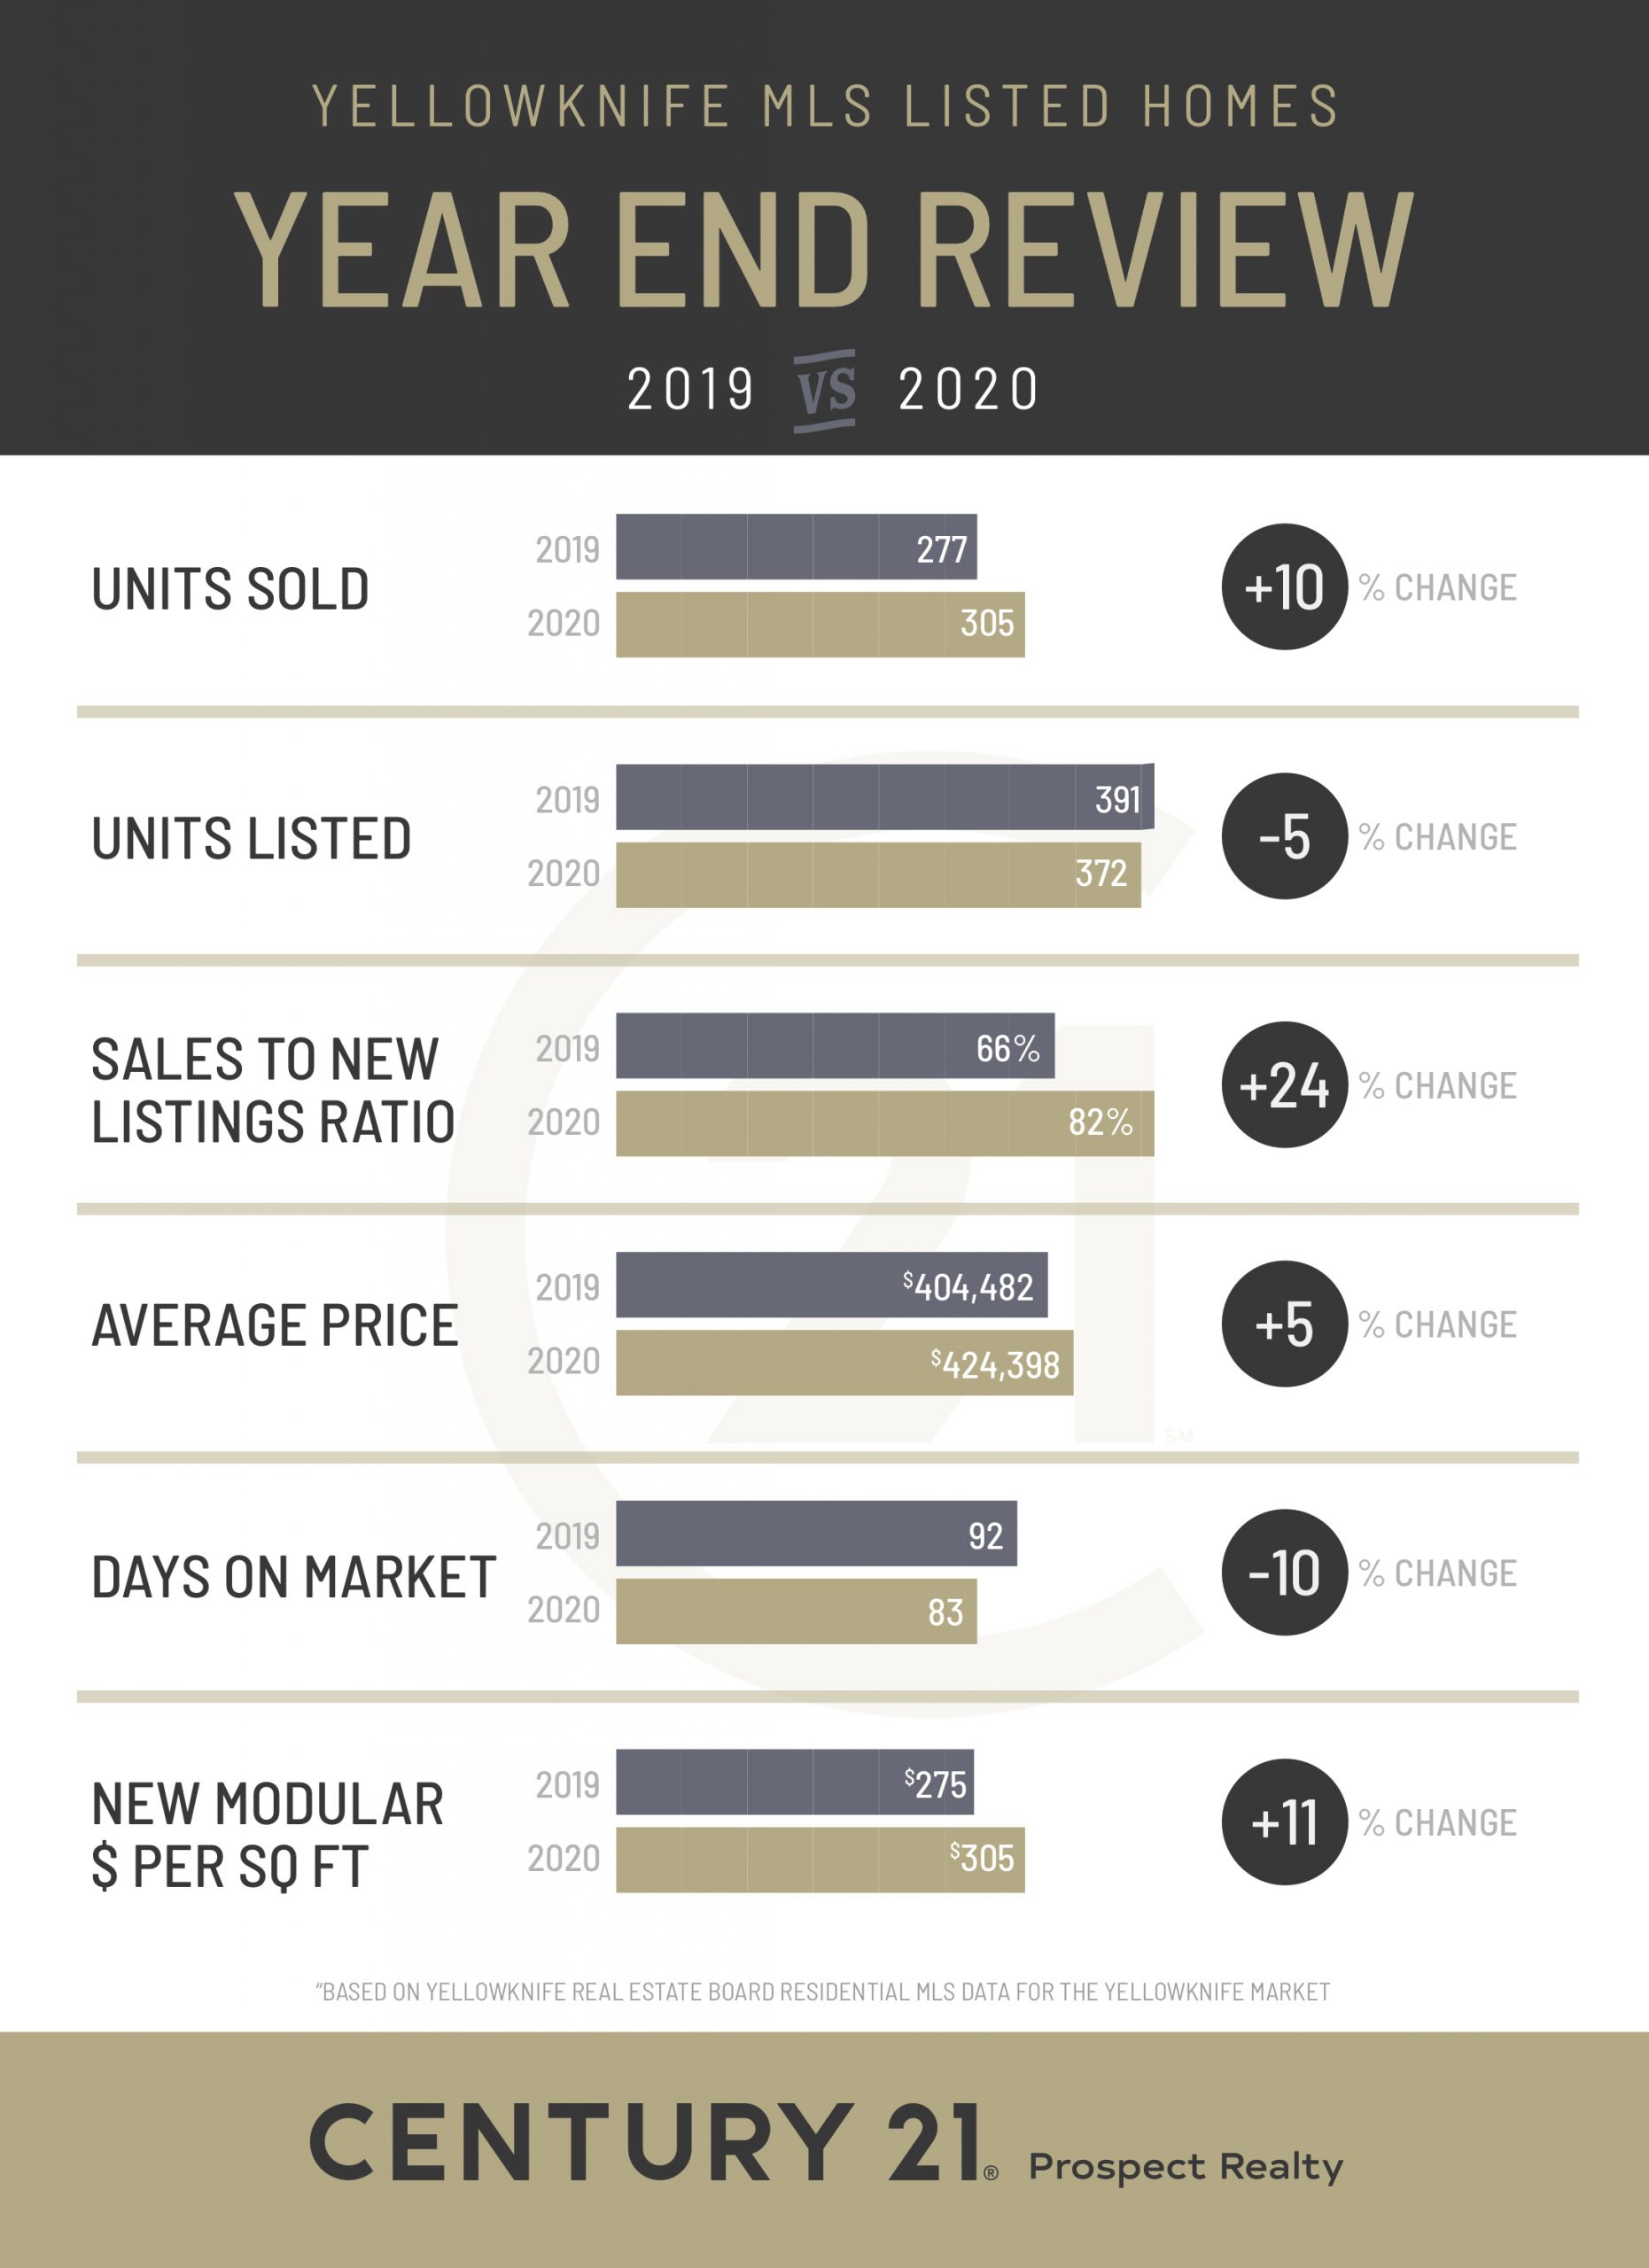
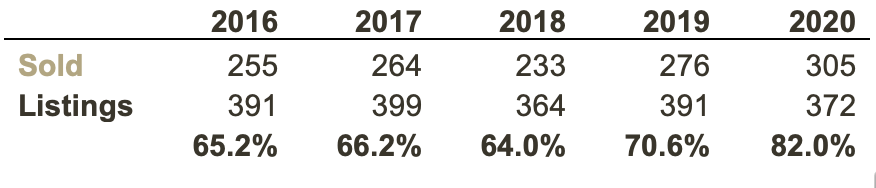
The graph below sums it up very well. Compared to the last five years, we had the highest number of sales and the second lowest number of listings. When you combine these two factors, you end up with a Sales-to-New-Listings Ratio* of 82% – well into seller market territory.

A lot of folks have asked me how it’s possible that sales are so strong, given that Yellowknife is normally such a transient city, and that right now people aren’t really able to come and go like they normally would. Can all of this business really just be coming from folks moving within town? Well, yes and no. We have all read headlines about people buying bigger homes because they are cooped up and want more space, or buying up lumber to build nicer back yard decks, buying snowmobiles, jet skis, etc. We’re seeing these trends here too, and this certainly accounts for some of the “locals-buying-local” real estate activity. But another big chunk comes from renters. Whether or not we’re in a pandemic, renting is an expensive proposition in Yellowknife and is something folks often do only temporarily until they can afford a down payment on a home. So the rental market is always a source of local demand for homes and probably even more so in a year when people are finding it easier to build up a down payment.
But it’s not just local demand that is driving the market. Yellowknifers have not experienced the same COVID-19-related restrictions on our lifestyles as many Southern Canadian residents, and because the public sector is such a huge employer up here, we haven’t had the same economic uncertainly either. Given these factors, people have continued to move here for work – probably in greater numbers than people going in the other direction for work or retirement. I don’t really have the quantitative data to back this up yet, but I suspect that when we eventually get statistics on employment and apartment vacancy, we’ll find that Yellowknife is about as full of people as it can be without adding net jobs and new houses. [UPDATE: the good people at the NWT Bureau of Statistics sent me data today confirming that we experienced less out-migration from the NWT in the 2nd and 3rd quarter of this year than any of the last ten years. People just aren’t moving out at the same rate as usual.]
I mentioned above that although our 2020 market was similar to the broader Canadian market in some ways, it was also different. That statement requires a bit more explanation. First, here is a graph from the Canadian Real Estate Association that shows you that we are not alone in experiencing plunging listing inventory levels and high Sales-to-New-Listings ratios.
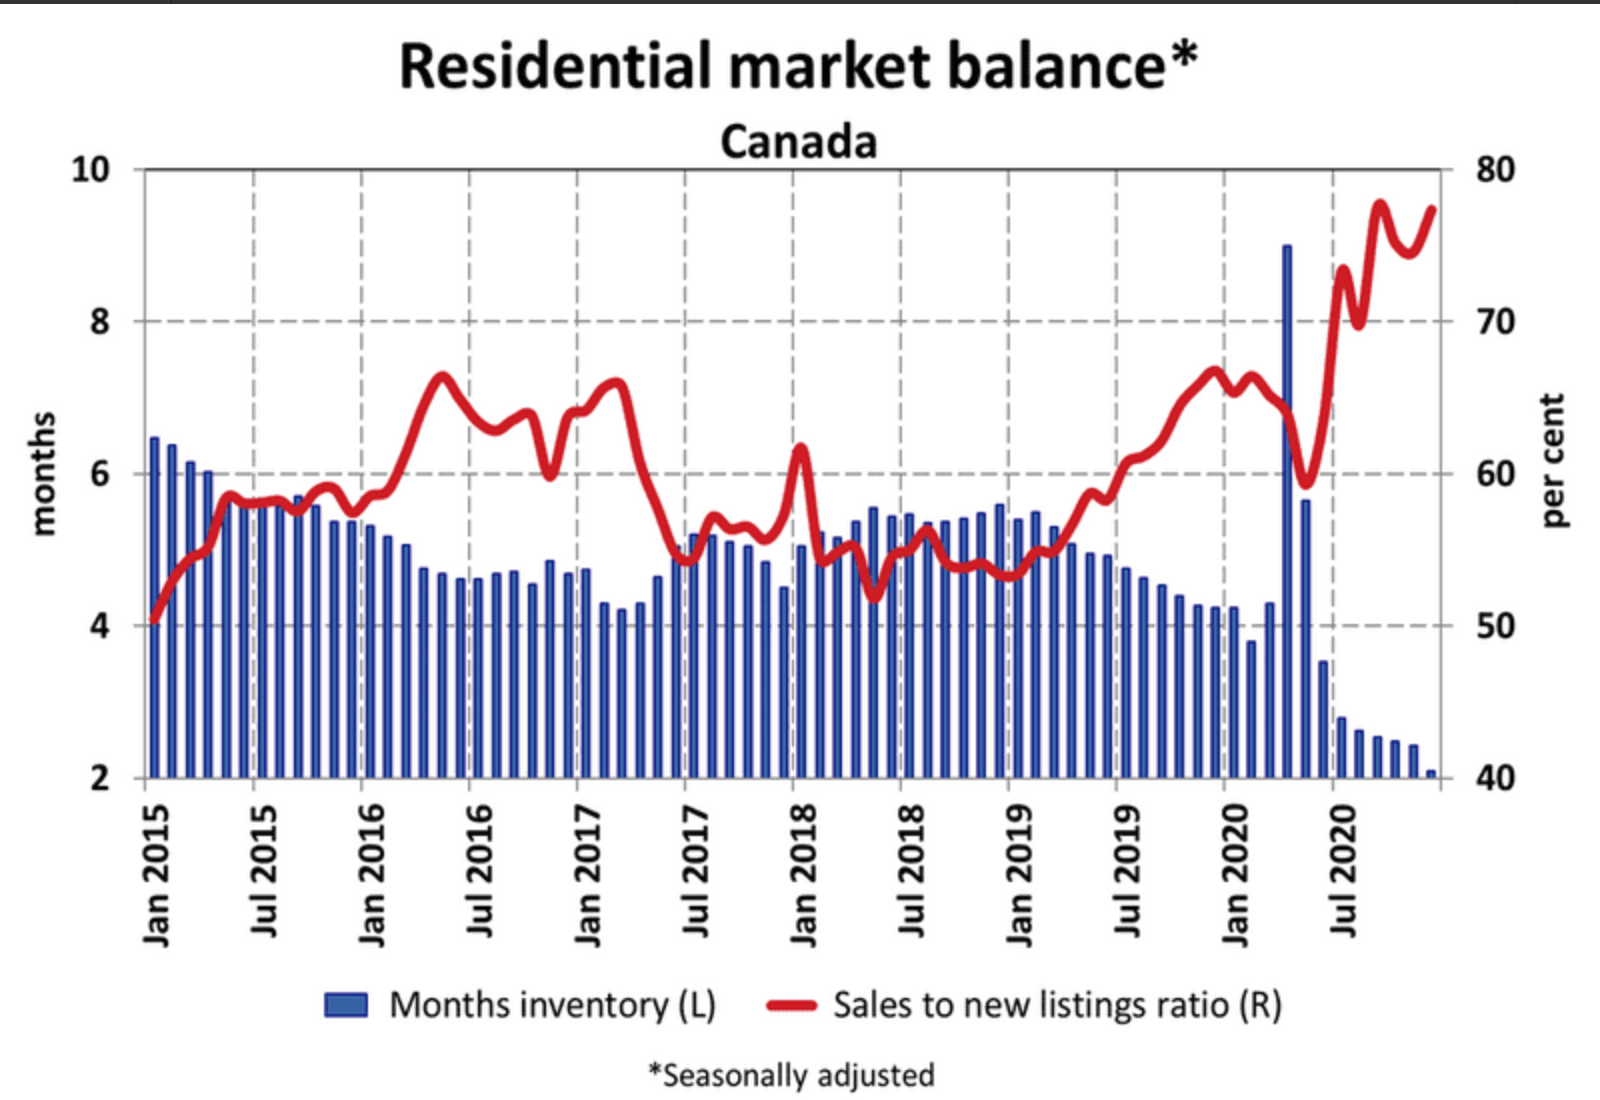
That’s a pretty crazy chart . There was a huge spike in inventory in April but then it resumed its nosedive while sales-to-listings went through the roof. We didn’t see anything quite as dramatic as that here, and we certainly didn’t experience the same price increases as many other places:
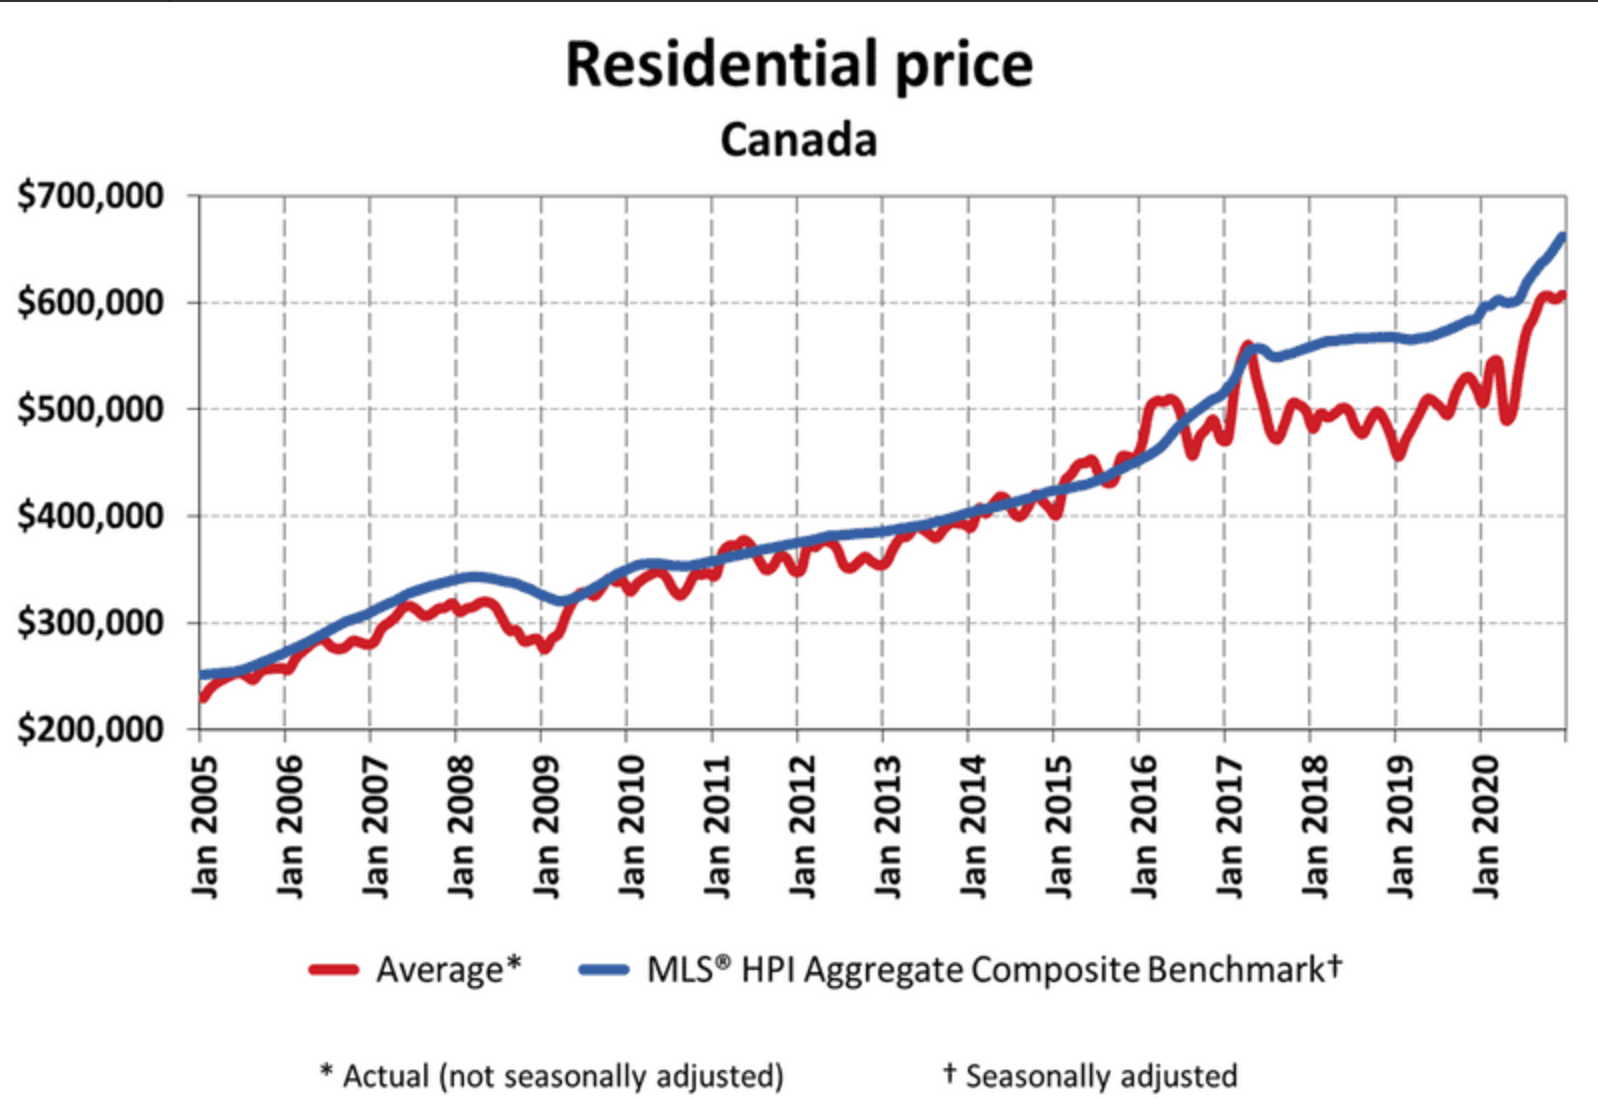
As folks who follow real estate news will know, the double-digit price increases in many cities were driven by the rise of remote working and a “flight to the burbs”. Condo prices in downtown Toronto, Montreal and Vancouver dropped significantly (or at least plateaued in the case of Vancouver) because employees have been permitted/forced to work from home. And since they can work from home, why not live a bit further away where homes are cheaper and bigger? Places like Woodstock Ontario (128km from Toronto) have seen price increases of almost 30% over last year. But in Yellowknife, we don’t have burbs, so we haven’t seen this same rush of buyers competing for what was previously very low-priced property relative to metro areas. Our year-over year price increase was a modest 5%.
Demand Still Weakest at the Top

The table above shows that although demand rose across the entire price range, the increase was weakest at the top, with only a 59% sales to new-listings ratio. That’s much better than it has been in years and technically the first “seller’s market” for this price segment in a long time, but without the addition of new high-paying jobs in Yellowknife and the NWT as a whole, and with other housing options available in the form of Grace Lake South “estate lots”, demand for resale homes remains relatively weak at the top end.
Manufactured Homes are Flying off the Shelf
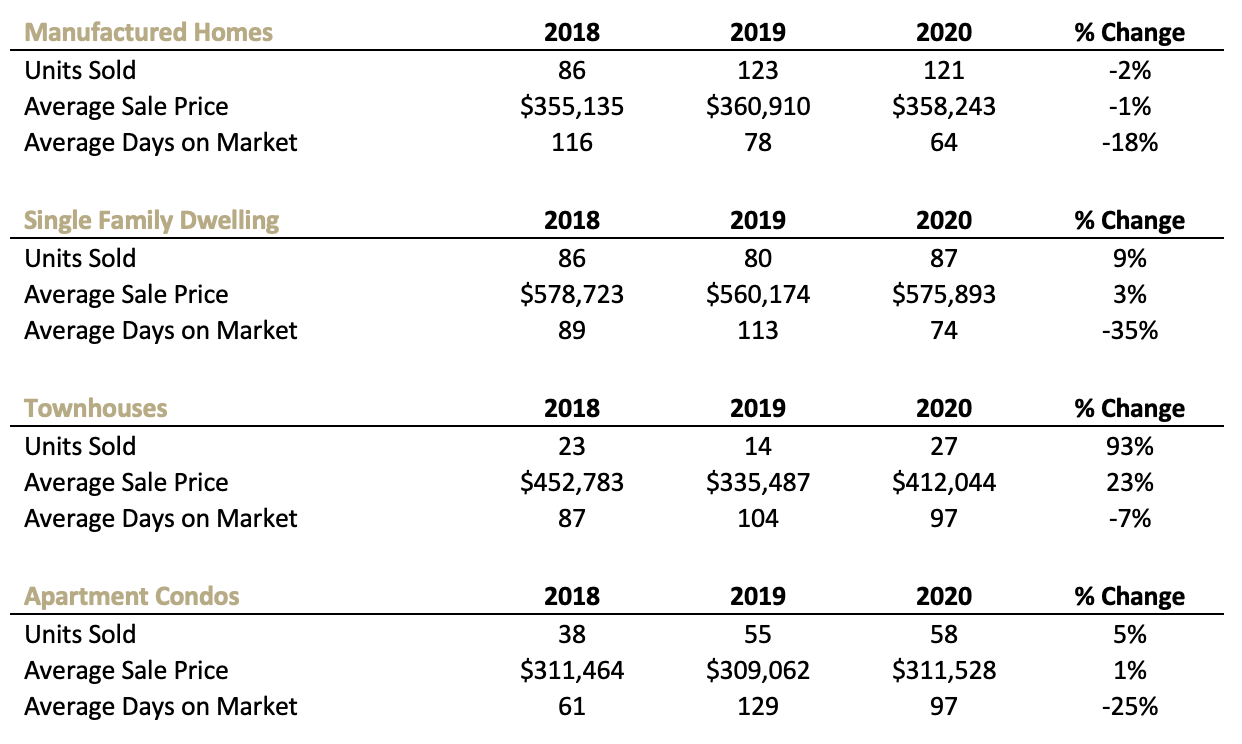
Just like 2019, manufactured homes led the pack both in terms of total units sold and the number of days required to sell each property. Since I began providing these monthly and annual market analyses I’ve been using the “mean” average to talk about “Days on Market,” but the even better indicator of how quickly these properties are selling is the “median” average. I’ve provided an explanation of the difference below** for anyone who cares to read it, but suffice to say that a median average isn’t impacted as heavily by an outlier where the Realtor or homeowner gets the price wrong and a listing takes years to sell. It’s a better reflection of what you can expect when you work with a Realtor and you both work hard to make sure the price is justified by comparable sales and market trends. I’ll be using median average exclusively in the future for days-on-market reporting. In 2020 the median average days on market per housing type was:
Manufactured Homes: 32 days
Single Family Dwellings (“stick built”): 39 days
Townhouses: 44 days
Apartment Condos: 53 days
Based on what we saw from Yellowknife’s real estate market in 2020, I am left feeling very lucky to live in this city. No, we don’t experience double-digit annual real estate appreciation as they do from time to time in other places, but we have stability that many markets can only dream of.
Thanks very much for taking the time to read this post. My next posts will explain what I think all of this means for home buyers and sellers in 2021. This is going to be a very busy year in our real estate sector – just how busy will depend on the timing of the easing of COVID-19 Restrictions.
Educating buyers and sellers about our real estate market is very important to all of us here at Century 21 Prospect Realty. If you have found this article useful, we would really appreciate a Google Review, if you’re up for it. Just follow this link: https://g.page/C21ProspectRealty/review?rc
*The Sales-to-New-Listings ratio has long been considered one of the most important metrics in the real estate industry. It compares the number of homes that came onto the market in a given period to the number of homes that found buyers in that same period. For example, 305 homes sold in 2020 and 372 listings came onto the market, for a ratio of 82%. This number is used to determine whether we are in a buyer’s, seller’s or balanced market. Analysts use the term “buyer’s market” when fewer than 35% of listings find buyers. Between 35%-55% we would be in a “balanced market”. Above 55% is considered a “seller’s market”.
**”Mean (or average) and median are statistical terms that have a somewhat similar role in terms of understanding the central tendency of a set of statistical scores. While an average has traditionally been a popular measure of a mid-point in a sample, it has the disadvantage of being affected by any single value being too high or too low compared to the rest of the sample. This is why a median is sometimes taken as a better measure of a mid point.”(Source: diffen.com)


